Chart view: bar, line and donut charts | Rodeo Docs
The chart view turns a database into a bar, line or donut chart that counts or sums your rows, so you can see the shape of your work without exporting anything to a spreadsheet.
Do it
Make a chart
Click + Add view and choose 📊 Chart.
The chart groups by the first Select or Status property. Change it under Group by at the top.
Under Value, choose Count to count rows, or Sum of a number, for example Sum of Words.
Pick bar, line or donut at the top left.
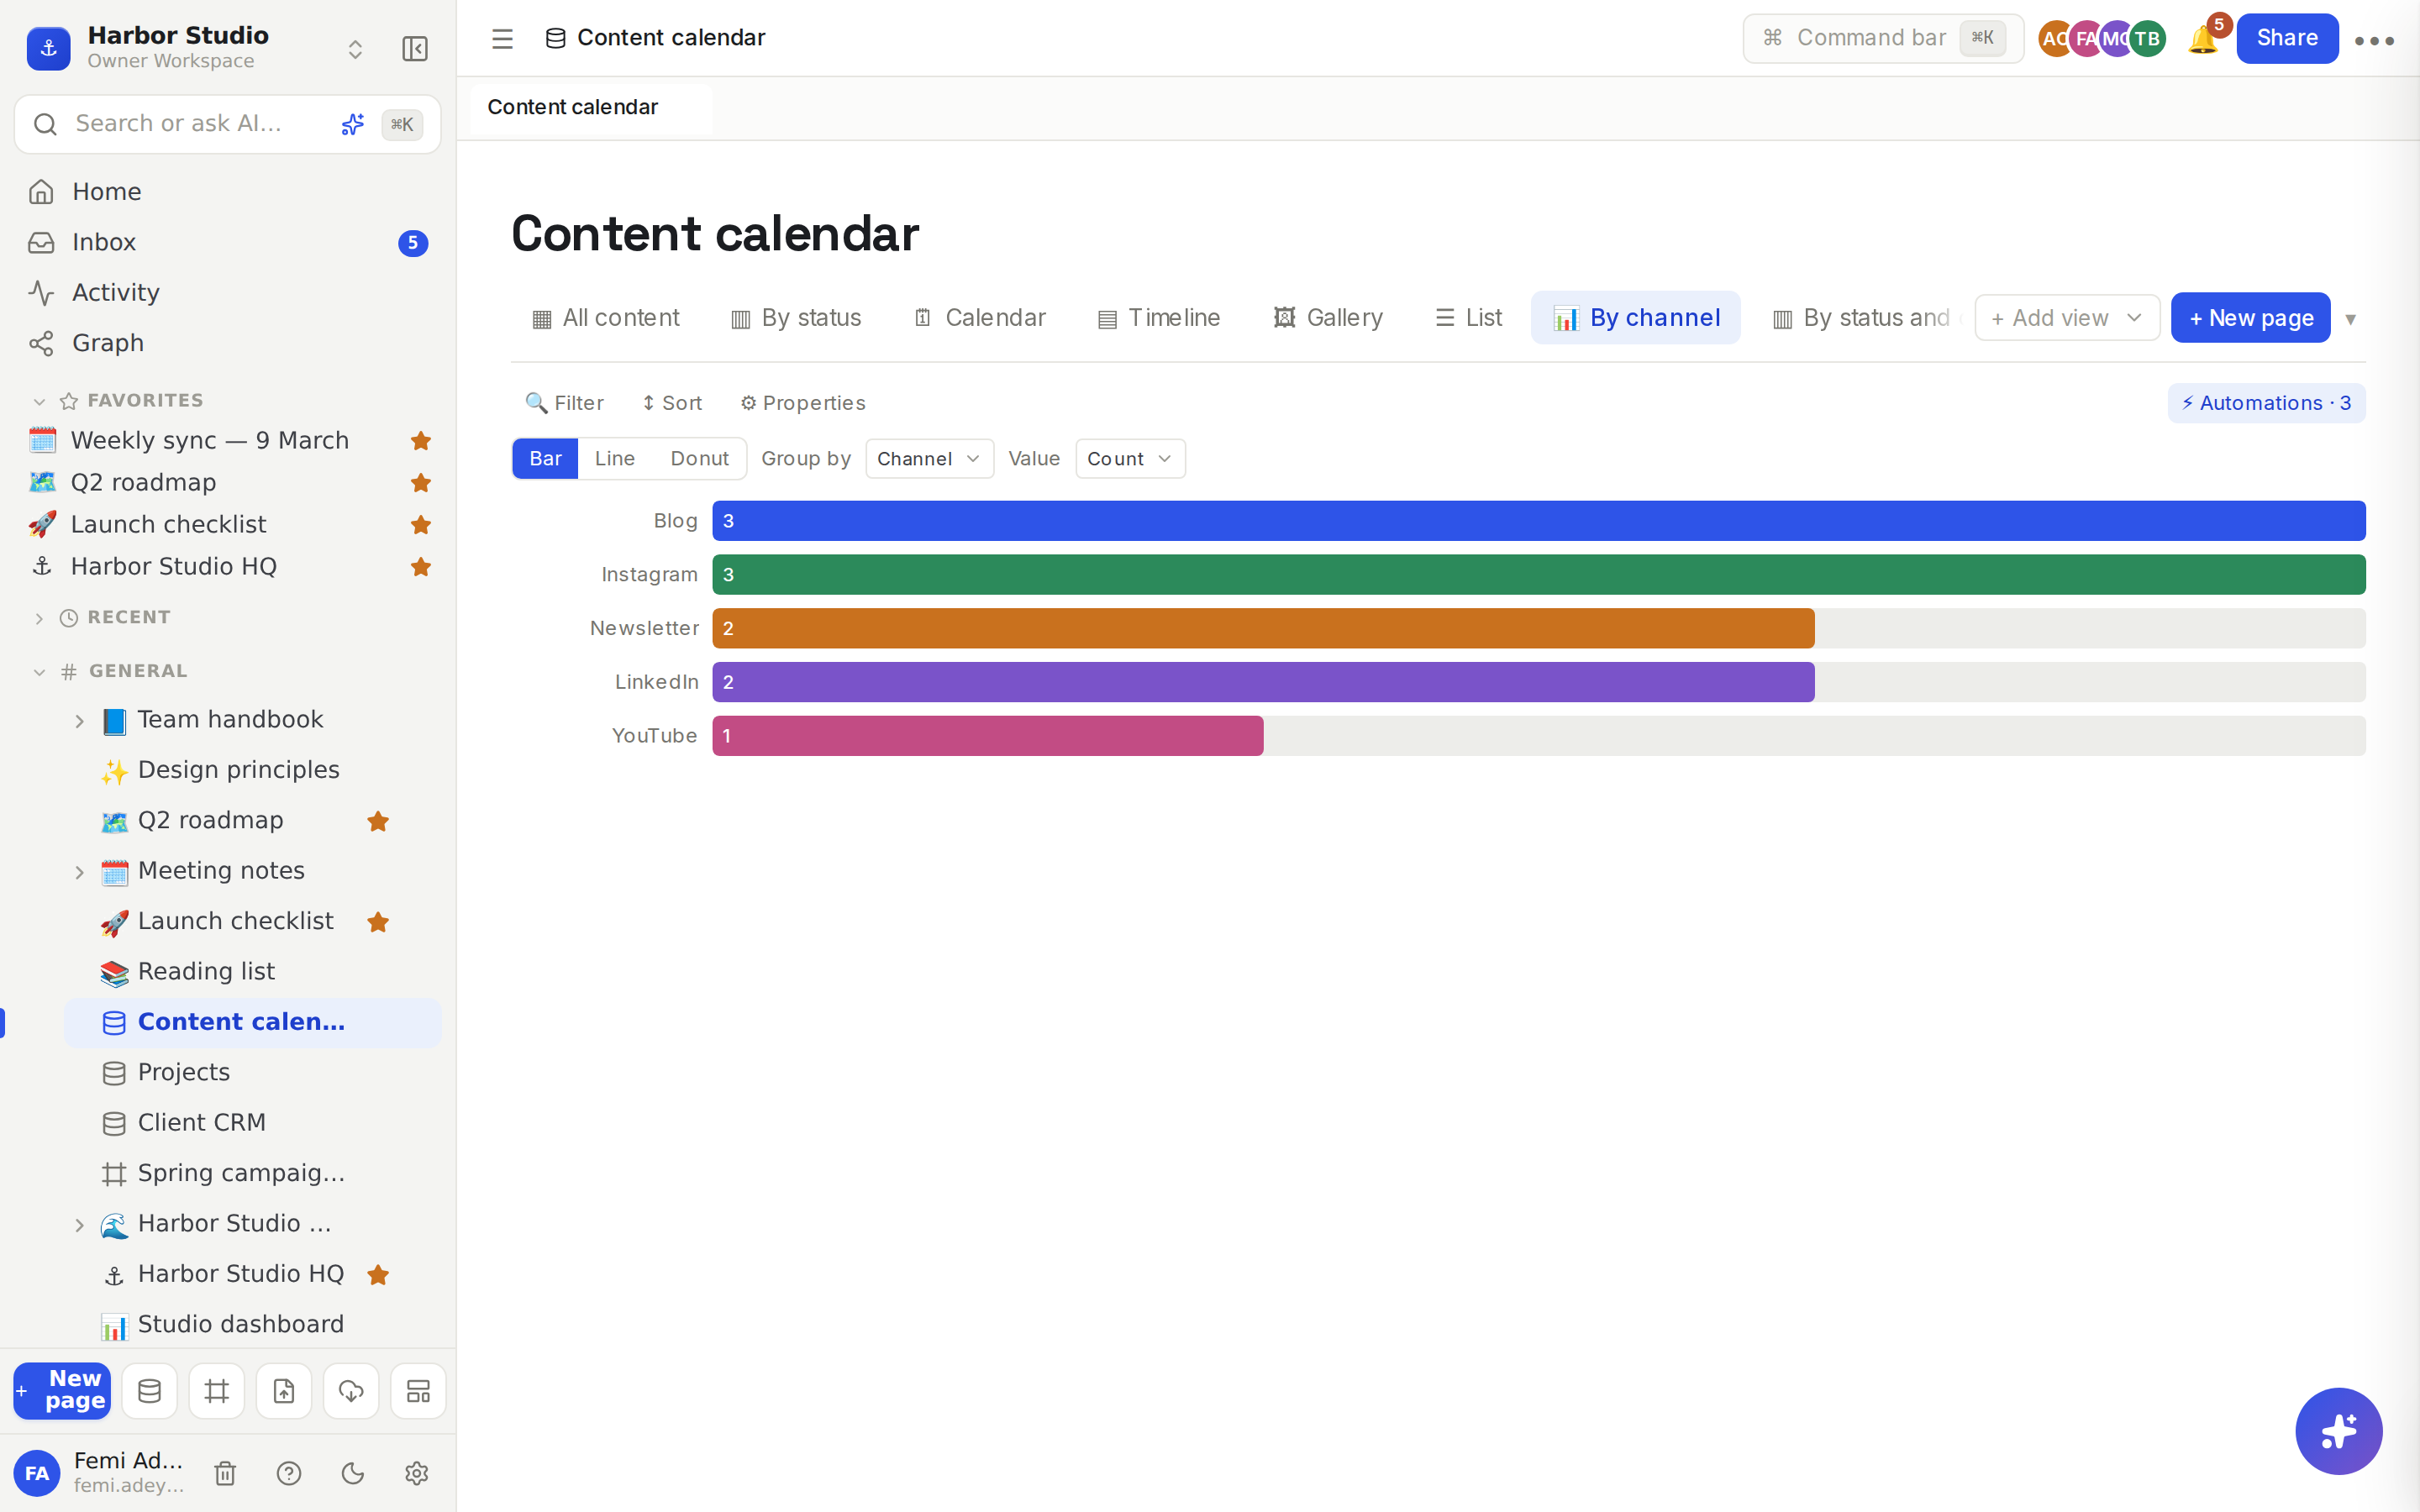
Double-click the tab to name it, for example "By channel".
Read it
Bar lists each group on its own bar, with the number on the bar.
Line joins the groups left to right, with each value above its point.
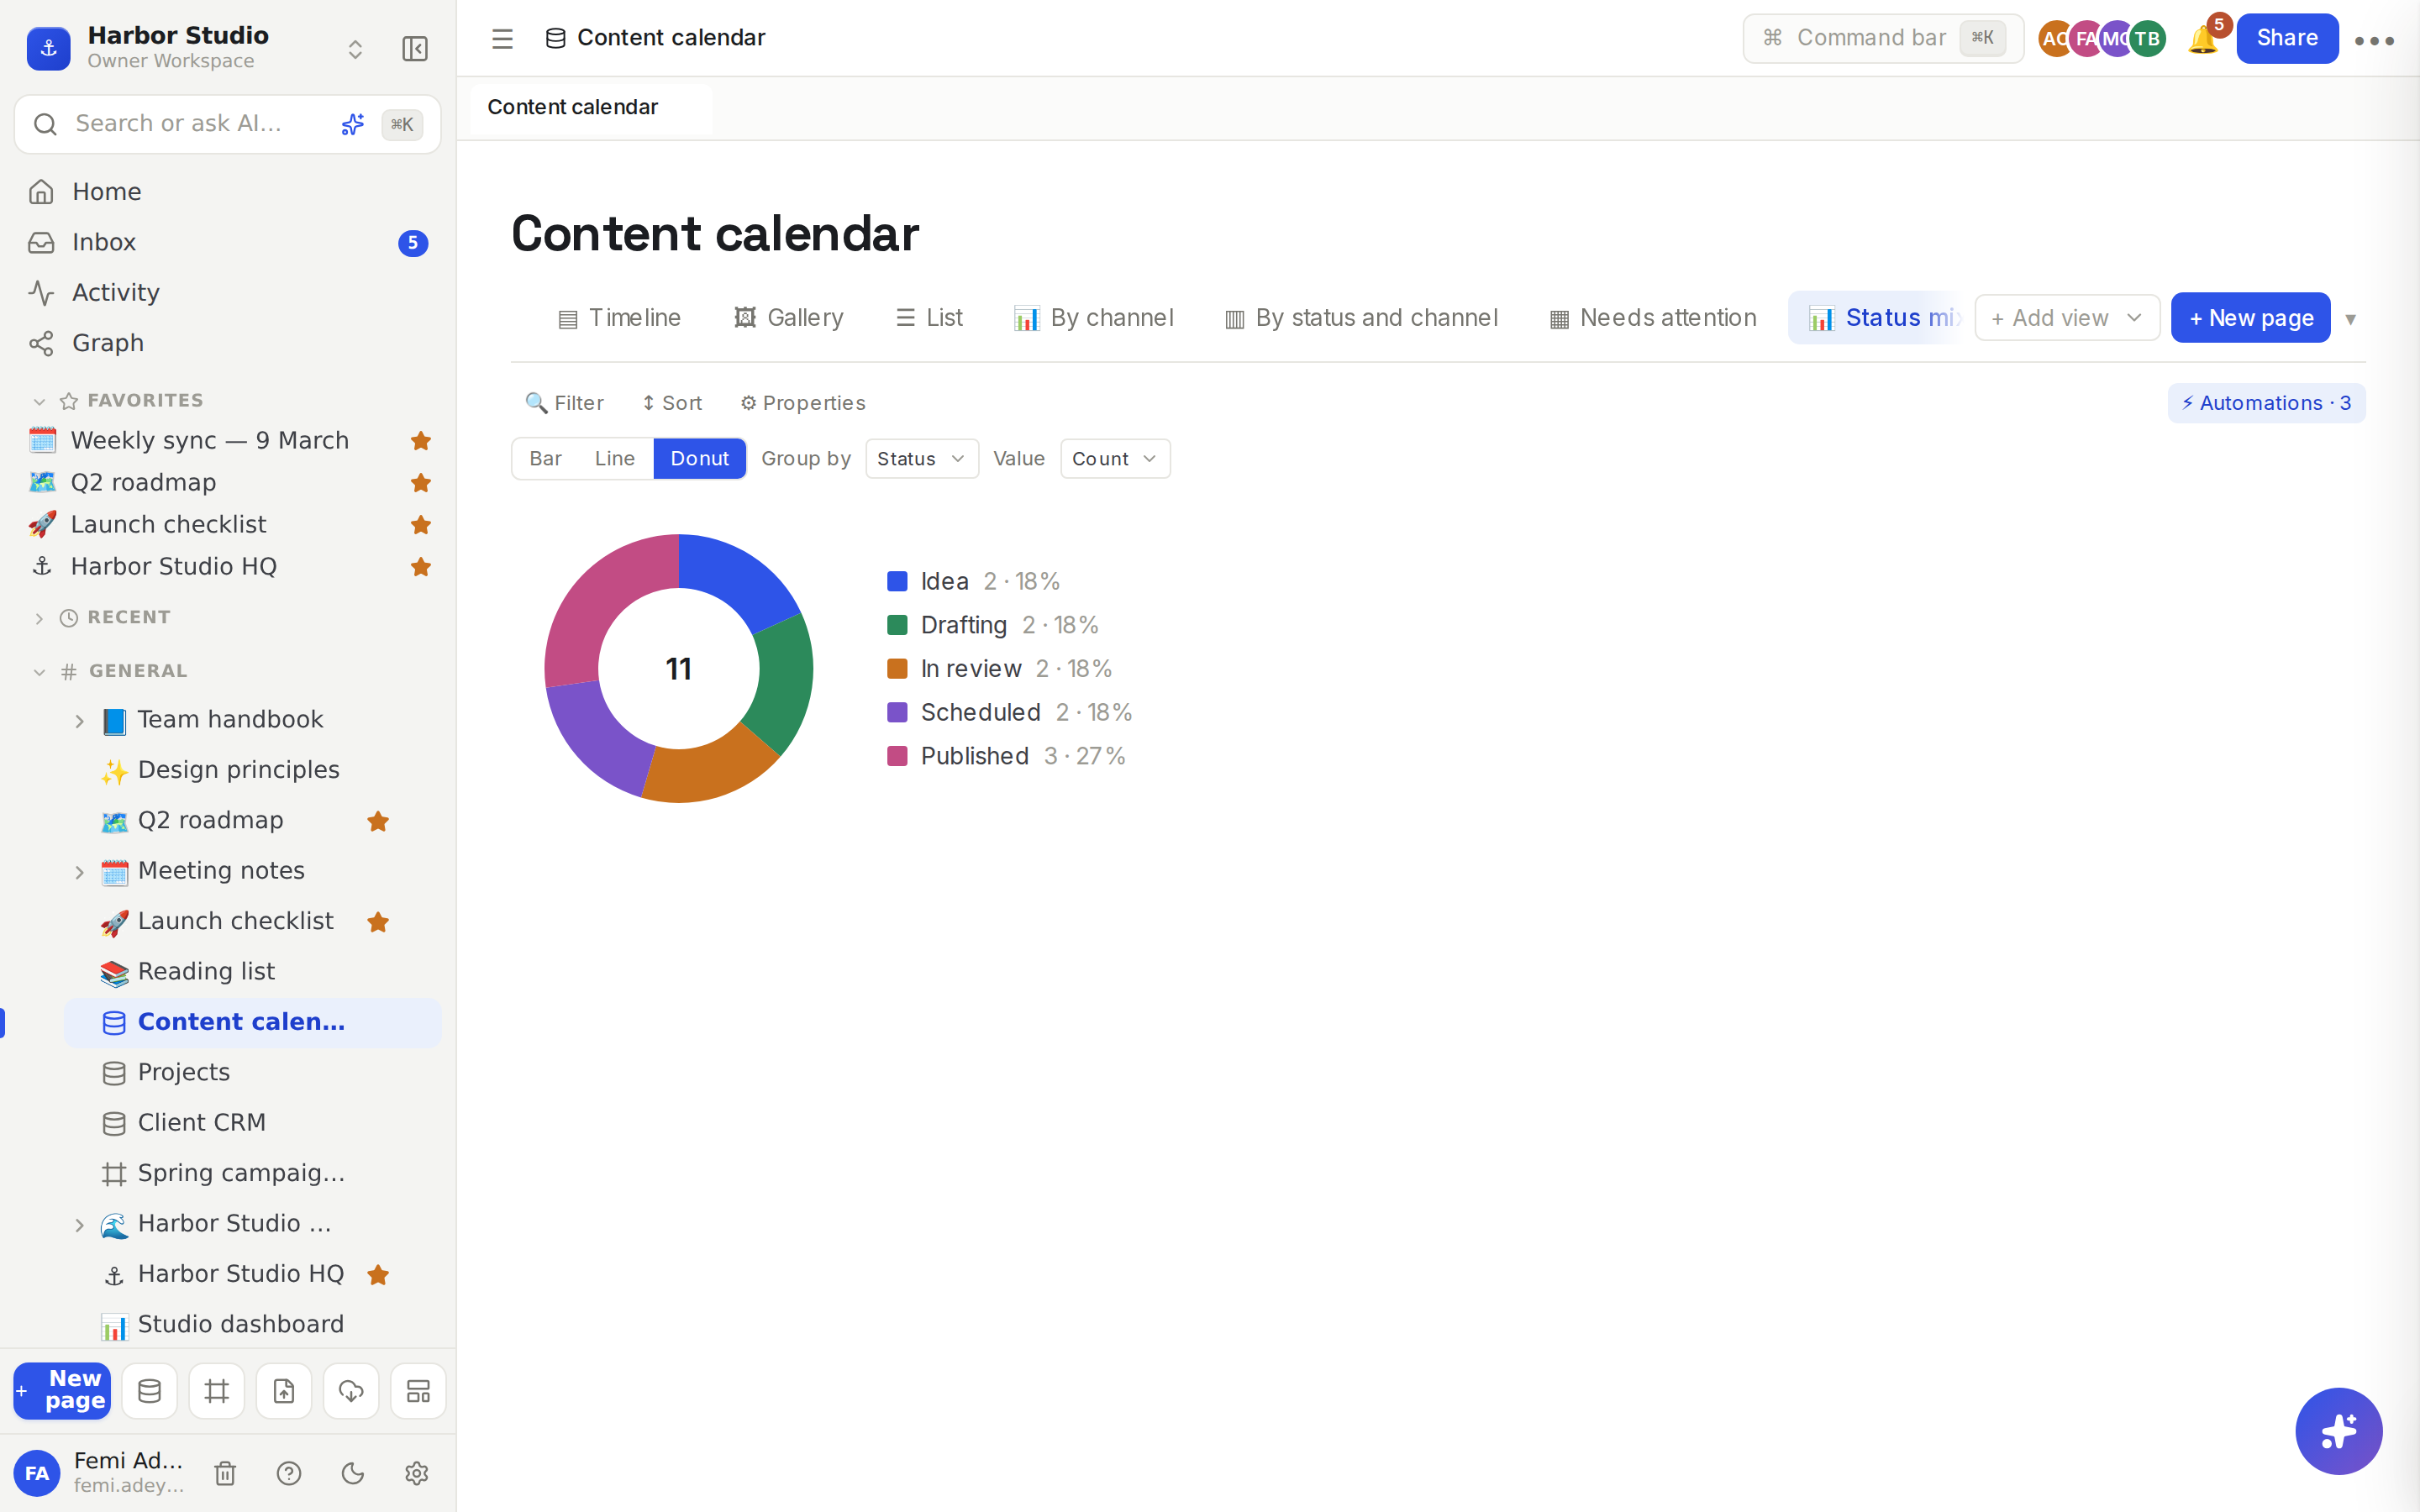
Donut shows the total in the middle and a legend with each group's value and its share as a percentage.
Tips and limits
Every row counts. Charts are worked out across every row that matches the view's filters, not just the rows loaded on screen.
Filter a chart to chart a slice, for example only this quarter's posts or only active clients. See Filters, sorts and grouping.
Group by almost anything. Select, status and multi-select group by option, a checkbox gives Checked and Unchecked, a date groups by day, and a relation groups by linked row. Rows with no value form a group called —.
Multi-value properties count a row once for each value, so with Multi-select or Relation, the groups can add up to more than the number of rows.
Order: select, status and multi-select groups follow the property's option order; other groups follow the order they first appear.
Sum of works with Number, Rollup and Formula properties.
Labels on a line chart are cut to their first eight characters; use a bar chart for long names.
The chart view works on every plan.
Ideas
Channel mix. Count content calendar posts by Channel each month, so Tunde can see LinkedIn is getting less love than Instagram.
Revenue by stage. In the Client CRM, sum Monthly retainer grouped by Stage as a donut, so Femi sees how much income is Active and how much is still a Proposal.
A dashboard page. Put a chart and a board side by side on one page with Linked databases, and the whole team opens one link on Monday.