Databases | Rodeo Docs
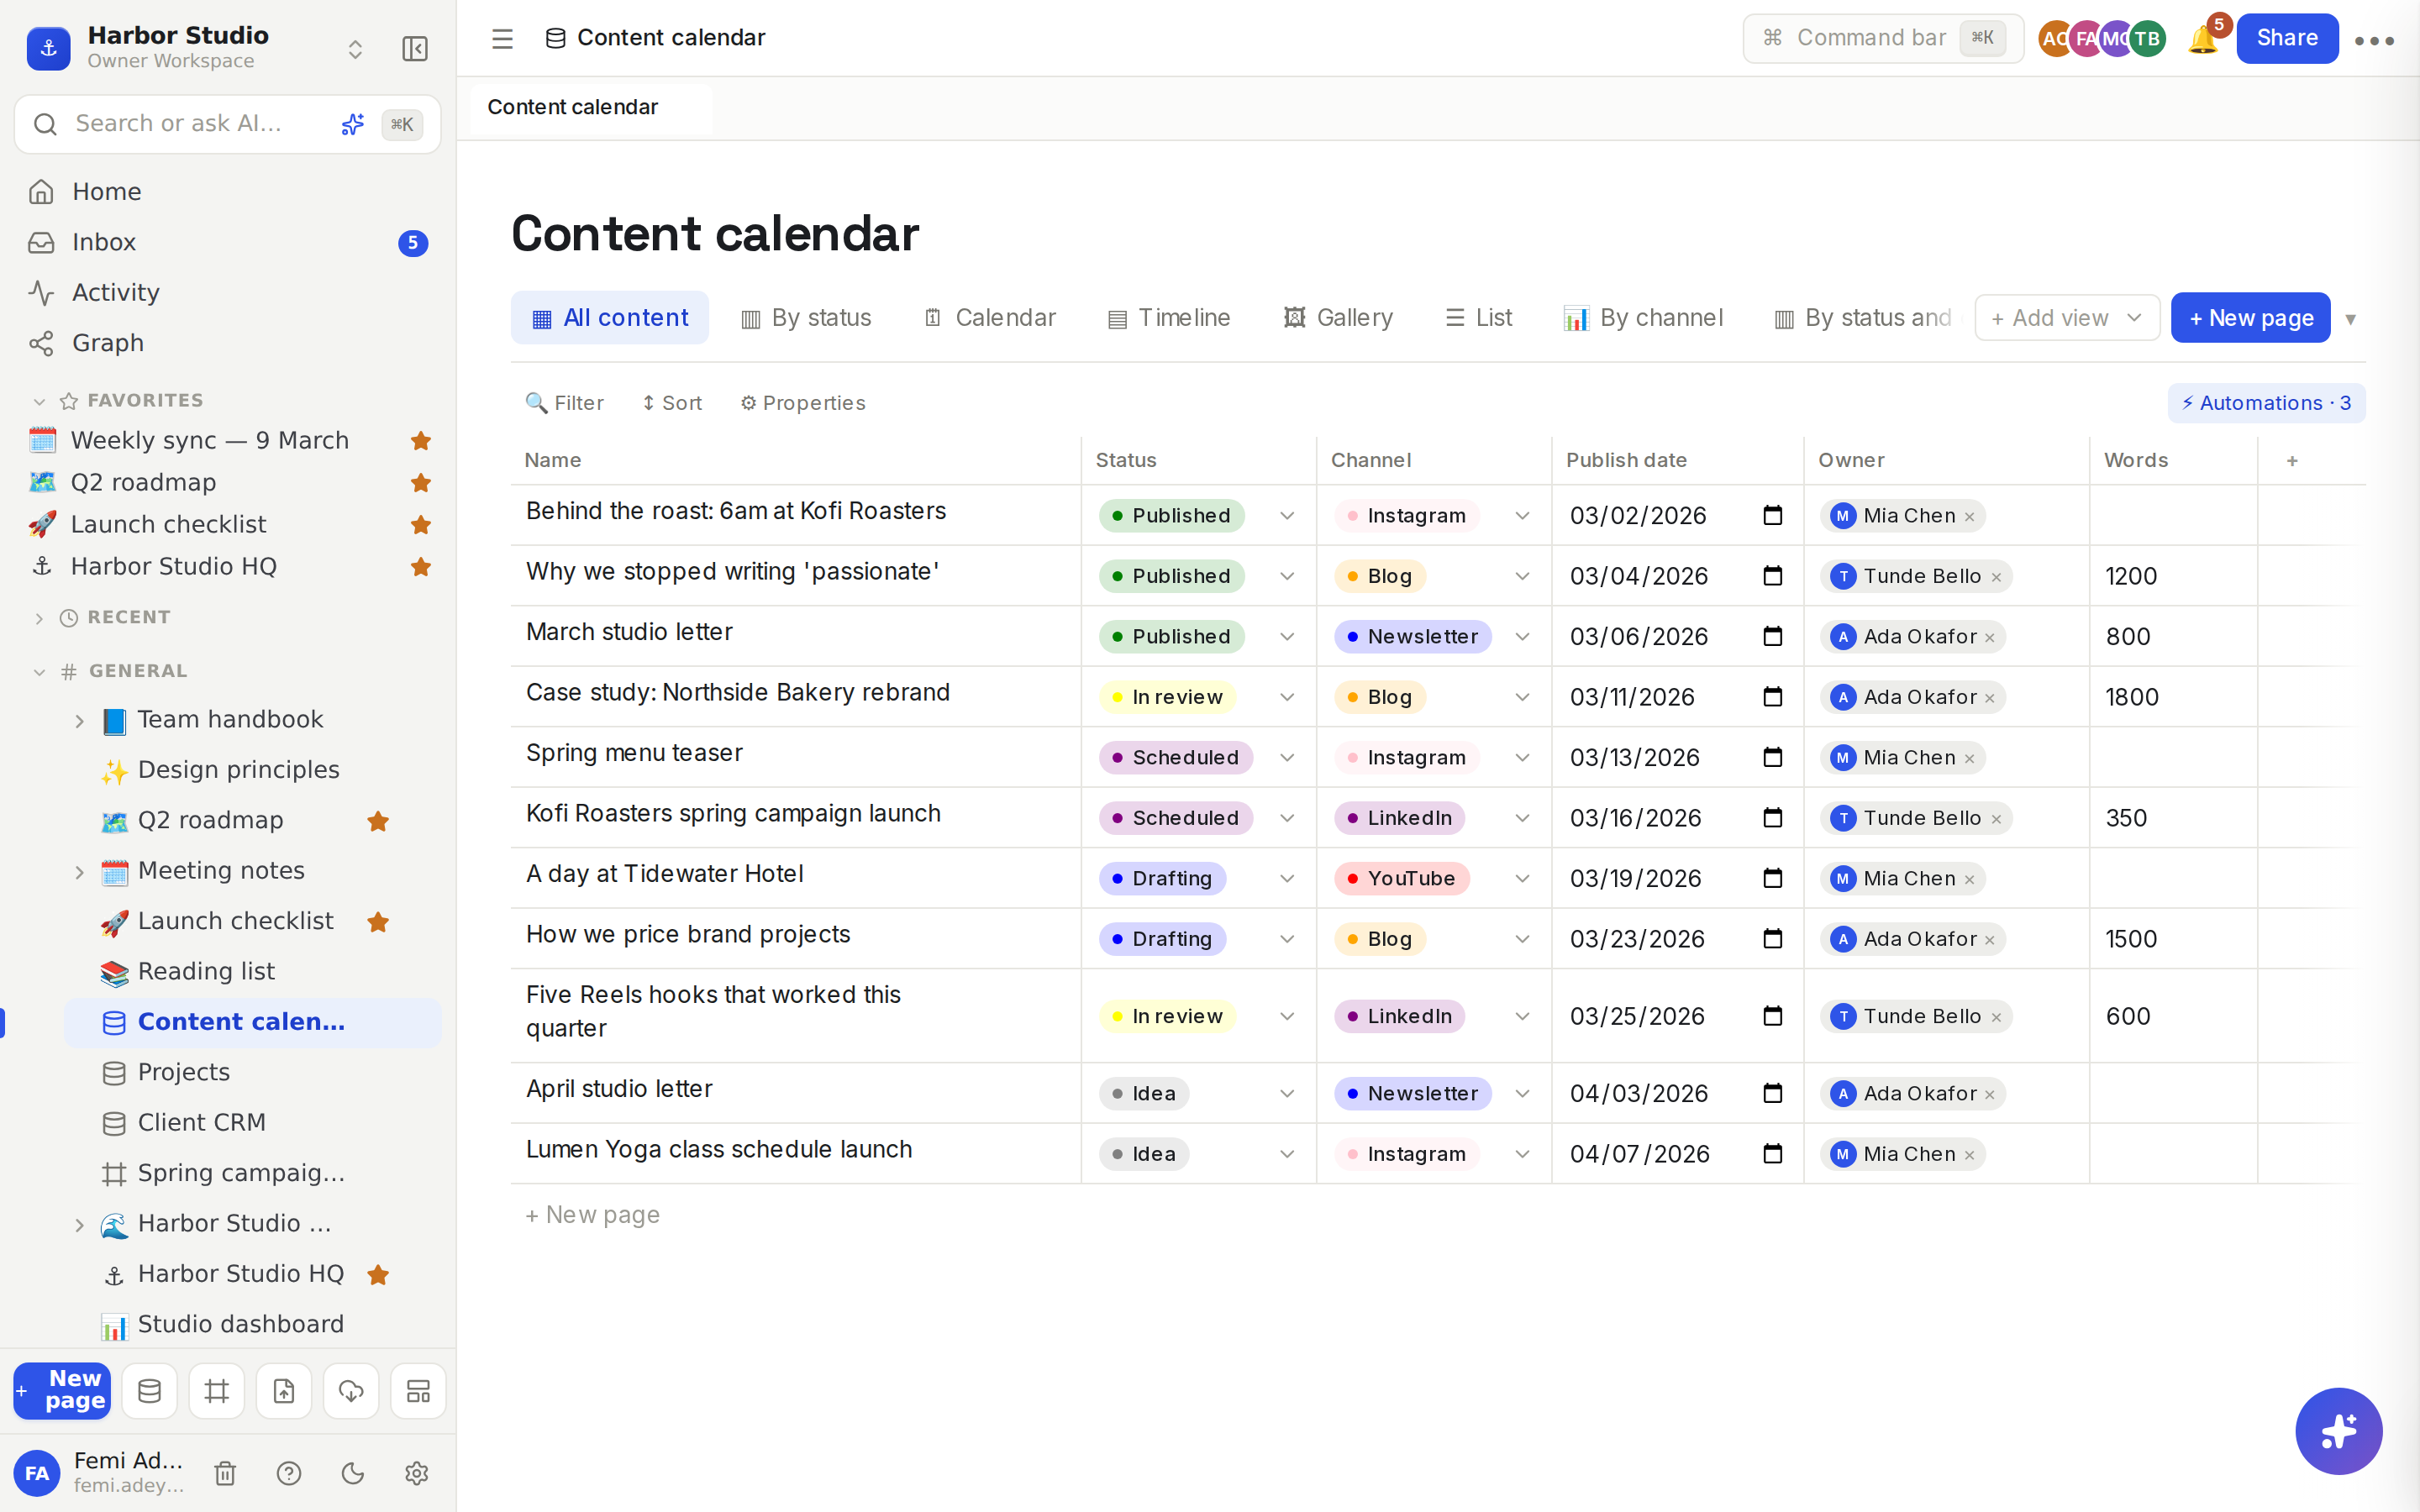
A Rodeo database turns a list into a working system: every row is a full page, every column is a typed property, and the same rows can be seen as a table, a board, a calendar, a timeline, a gallery, a list, a chart or a form. Harbor Studio runs its whole content calendar and client CRM this way, and links them together with relations, rollups and formulas. This section takes you from your first database to dashboards, automations and public forms.
Build your first database
Begin with Database basics: what a database is, how to make one, how to add rows, and how to add and manage views. Next, Properties explains the 19 property types that give each column its meaning, and how to change a property's type safely once you have data. When a value should be worked out rather than typed, Formulas covers every operator and function the formula language has.
Because every row is a page, each one can hold notes, files and comments of its own. Row pages and row templates shows how to open a row as a page, and how to start new rows from a saved template.
See your rows the way you need them
One set of rows can be looked at in many ways, and each view keeps its own layout:
Table view for spreadsheet-style editing, with columns you can resize and reorder.
Board view for a kanban board grouped by status, with sub-groups and coloured columns.
Calendar view puts rows on a month grid by any date property, and Timeline view draws them as bars from a start date to an end date.
Gallery view shows rows as cards with a cover image, and List view keeps things calm with one line per row.
Chart view counts or sums your rows as bar, line and donut charts.
Whichever view you're in, Filters, sorts and grouping shows just the rows you need, in the order you need them.
Connect and automate
Databases get more useful when they talk to each other. Relations and rollups links rows across databases, so a client can list its projects, and totals up what's linked. Automations runs "when this happens, do that" rules for you, including filling in properties with AI. To put a live database inside any page and build a dashboard, use Linked databases.
Bring data in, and collect it
Already have a spreadsheet? Import from CSV turns it into a database in one click. To gather entries from your team, or from anyone with a link, Forms collects each answer straight into a database as a new row.